Welcome to the Inedo Forums! Check out the Forums Guide for help getting started.
If you are experiencing any issues with the forum software, please visit the Contact Form on our website and let us know!
Buildmaster - High CPU database since 6.2.22
-
Hello
The SQL Serve is anormally overloaded since release 6.2.22.
One request :
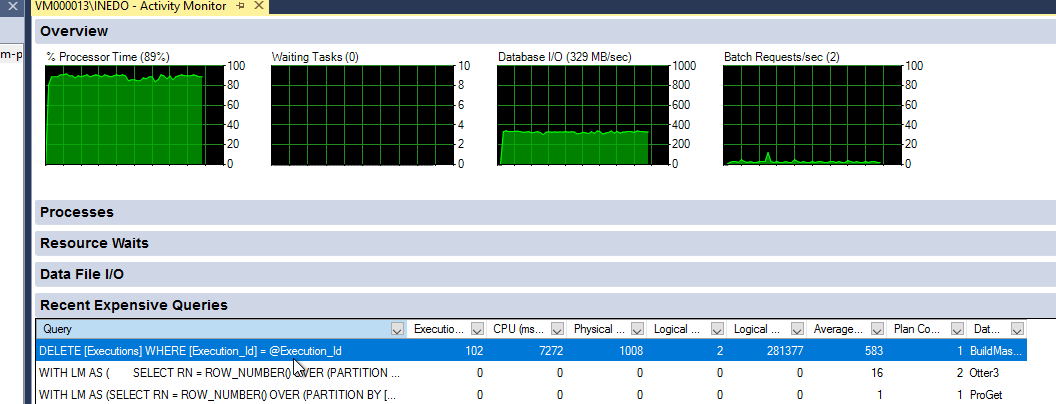
DELETE [Executions]
WHERE [Execution_Id] = @Execution_Id
seems to impact a lot the serverI have seen two big table (7 Go and 12 Go):
dbo.ScopedExecutionLogs / dbo.ScopedExecutionLogEntriesany advice is welcome
Best regards
Philippe -
Hi Philippe,
I don't think there's anything in particular that would have changed that would cause this slowness.
Those tables are big, and I would definitely recommend purging old data from them.
In any case, the problem is likely index fragmentation. Deleting an execution will cascade to those tables, so I'm thinking there might be some kind of indexing fragmentation or problem.
Here's some information about how to detect and repair index fragmentation: https://inedo.com/support/kb/1167/sql-server-recommendations
Can you try that, and see if it helps?
Thanks, Alana
-
Hello @atripp
I repaired the index, and it seems to help :)
I let you know what I still have the problemBest Regards
PhilippeC. -
Hi @atripp
The problem is stil present.
Do you have any magic sql scripts to purge my huge tables ?
Thanks in advance -
Typically these are cleaned up via retention policies... but where is the
DELETE [Executions] WHERE [Execution_Id] = @Execution_Idbeing called? -
Hello @atripp
This the Manual Execution Cleanup.This process is really annoying.
You have no SQL scripts to cleanup the table ?
-
We can definitely try to diagnose what's going on. What are the types of Executions in that table? Manual? Build? Etc?
-
@atripp said in Buildmaster - High CPU database since 6.2.22:
what are the types of Executions in that table? Manual? Build? Etc?
Sorry, I am not sure to understand what you expect.
I guess every log - manual / build / deployement.I have setup this in the Administration part:
- Diagnostics.MinimumLogLevel : 20
- Retention.KeepLastManualExecutionCount: 1000
I have 3 Retention policies:
- Delete deployed release Retain 180 days
- Delete artifacts for rejected build : Retain 30 days
- Delete execution logs : retain 30 days
Therefore, logs haven't been removed for more than 36 month !!!
I have the same in ScopedExecutionsLogEntriesSELECT TOP (10) [Execution_Id] ,[LogEntry_Sequence] ,[Scope_Sequence] ,[LogEntry_Level] ,[LogEntry_Date] FROM [Otter].[dbo].[ScopedExecutionLogEntries]Execution_Id LogEntry_Sequence Scope_Sequence LogEntry_Level LogEntry_Date 14 1 1 0 2019-04-02 09:09:23.500 14 2 1 0 2019-04-02 09:09:23.500 14 3 1 10 2019-04-02 09:09:23.500 -
Hey @philippe-camelio_3885
You may be looking at the wrong database... based on
Otterin your query.Here's a way to see executions by execution type:
SELECT [ExecutionMode_Code], COUNT(*) FROM [BuildMaster]..[Executions] GROUP BY [ExecutionMode_Code]As for retention policies, you should be able to see the logs of those., and see what's being purged.
Anwyays, w'ell figure it out... hang tight!
-
@atripp
Houps !
About the retention policies, when I start them manually, they remove few lines.
Here is the result of the SQL:
R 91369
M 164051
S 1560
T 377
B 999Thanks
Philippe -
Thanks Philippe!! That's helpful.
Can you try this sql?
USE [BuildMaster]

BEGIN TRANSACTION

DELETE [Executions]
 WHERE [ExecutionMode_Code] IN ('R', 'M', 'T')
   AND ROW_NUMBER() OVER(PARTITION BY [ExecutionMode_Code] ORDER BY [Execution_Id] DESC) > 1000

SELECT [ExecutionMode_Code], COUNT(*) FROM [Executions] GROUP BY [ExecutionMode_Code]

ROLLBACK
You should then see results like this:
R 1000
M 1000
S 1560
T 377
B 999
You can further inspect the tables, but this should do the trick. If the results look okay, then please run only the
DELETEstatement and then it will be fine.Can you let me know if it works? we will incorporate this logic in BM-3659
-
I have this error msg from SQL Management Studio or from osql
Msg 4108, Level 15, State 1, Line 7
Les fonctions fenêtrées peuvent uniquement apparaître dans les clauses SELECT ou ORDER BY
I am not good enough in SQL to overcome this. Any tricks ?
-
My bad, can you try this instead? Basically we are trying to delete all "R, M, T" executions except the most recent 1000 of each type.
This is what the code is doing now, just really inefficiently for some reason -- and the inefficiency seems to have caused a "backlog" of sorts.
USE [BuildMaster] BEGIN TRANSACTION DELETE [Executions] FROM [Executions] E, (SELECT [Execution_Id], ROW_NUMBER() OVER(PARTITION BY [ExecutionMode_Code] ORDER BY [Execution_Id] DESC) [Row] FROM [Executions] WHERE [ExecutionMode_Code] IN ('R', 'M', 'T')) EE WHERE E.[Execution_Id] = EE.[Execution_Id] AND EE.[Row] > 1000 SELECT [ExecutionMode_Code], COUNT(*) FROM [Executions] GROUP BY [ExecutionMode_Code] ROLLBACK -
Buildmaster is broken

Time out when I try to get an access to BM.I reboot unsuccessfully
but the Database is clean
R 1000 M 1000 S 1586 T 380 B 1025 -
I had to stop SQL Instance, Restart BM Service
Everything looks fine -
The request still eating all my CPU :(
-
How often is this happening? It shows 102 executions were purged, and based on the I/O there was a lot of logs deleted... this can be actually quite resource-intensive, as there are a lot of log data.
But this usually happen during off-hours, etc., so it shouldn't be disturbing.
-
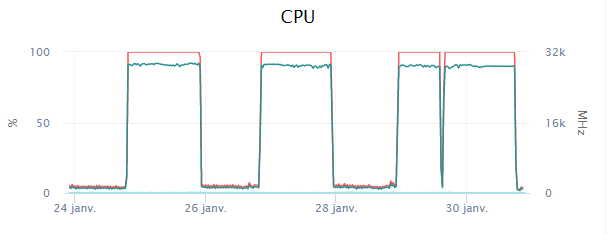
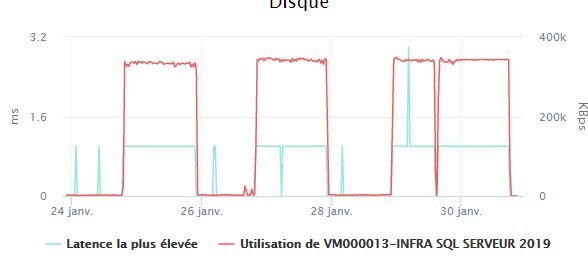
@atripp
Unfortunately, it is disturbing.I join 2 screenshoot about the impact of the delete sql and it is happening during working hours.
I find that deleting several hours of CPU and IO for only 102 purged executions take too long
As I said, the problem exists since release 6.2.22.
I stopped all retention policies,
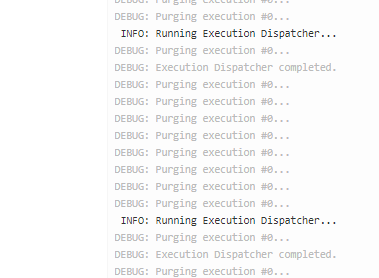
The problem occurs when the Manual Execution Cleanup is running
==============
I ran again your code:
Before the execution: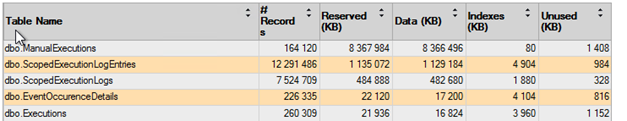
After
(255268 rows affected)

Completion time: 2021-01-30T22:06:02.9603752+01:00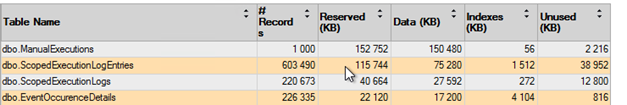
SELECT [ExecutionMode_Code], COUNT(*) FROM [Executions] GROUP BY [ExecutionMode_Code]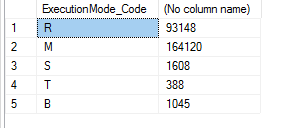
I set Retention.KeepLastManualExecutionCount to 50.
I will see what is going on
Best Regards
PhilippePS - Thanks for the help
-
This is what is happening if I force Manual Execution Cleanup to run.
The stop of the BuildMaster Service solved the problem, but BM is down :(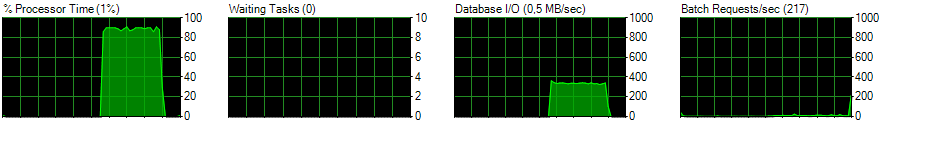
To be more complete, here is the steps I followed
1 Execution of the delete script
2 Restart buildmaster
4 Start Manual Execution Cleanup ==> Problem occurs
4 Start Manual Execution Cleanup ==> Problem occurs -
If I'm understanding correctly, did your the Manual Execution records go from 1000 to 164,000 in just a few days? If so, that would explain a lot....
These are the types of so-called Manual Executions:
- Importing or Exporting Applications
- Cloning and Applying Template to Applications
- Sync of Issue Sources
- Deploying Configuration file
- Upgrading Inedo Agents
- Sync infrastructure
They are supposed to only occur on a manual basis, like when you trigger something from the UI so you can get logs. Or, in the case of sync infrastructure, whenever infrastructure changes.
Any idea what all the manual executions could be?
Hello! It looks like you're interested in this conversation, but you don't have an account yet.
Getting fed up of having to scroll through the same posts each visit? When you register for an account, you'll always come back to exactly where you were before, and choose to be notified of new replies (either via email, or push notification). You'll also be able to save bookmarks and upvote posts to show your appreciation to other community members.
With your input, this post could be even better 💗
Register Login