Regarding How should ProGet logs be forwarded to Grafana/Loki? one way would be to forward the docker logs to Loki. But the layout of the log lines is not consistent. It looks like there are different loggers writing the stdout in different formats.
Posts made by pg_user_8607
-
RE: Problem with setting up LDAP in ProGetposted in Support
-
Problem with setting up LDAP in ProGetposted in Support
Hi there,
I followed the documentation here:
https://docs.inedo.com/docs/installation/security-ldap-active-directory/various-ldap-openldap
Unfortunately, I have not been able to get the connection working so far.
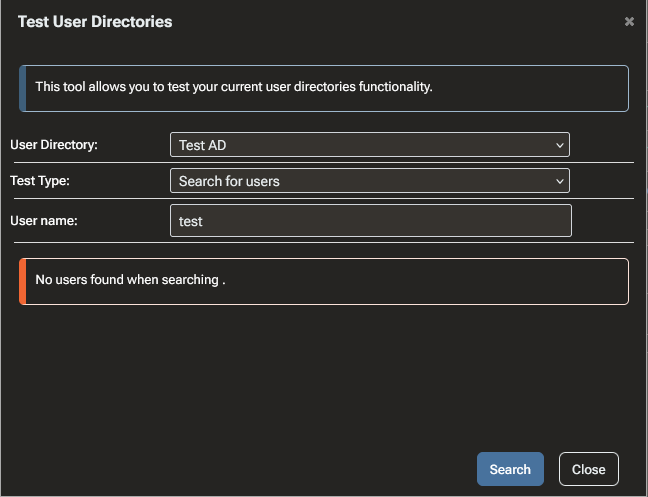
The LDAP test dialog looks like this:

From what I can tell, it seems to fail somewhere around this code path:
The container logs only show the following:
2026-05-18T14:20:14.414550674Z Begin LDAP Get Search Results 2026-05-18T14:20:14.448461026Z LdapReferralException 2026-05-18T14:20:14.448488541Z LdapReferralException 2026-05-18T14:20:14.448603052Z LdapReferralException 2026-05-18T14:20:14.448612606Z End LDAP Get Search ResultsThe main problem is that the logs do not contain the actual exception message or stack trace. They only show
LdapReferralException, so it is difficult to understand what exactly is going wrong or how to fix the LDAP configuration.I have a few questions:
- Where should ProGet container logs be written?
The container has a mounted volume at:
/var/proget/logsHowever, this directory is empty. Is this expected behavior for the container image, or should ProGet write log files there?
-
How can I increase the log level?
I found this forum thread:https://forums.inedo.com/topic/3060/defining-log-level/4?_=1779106499495
But I was not able to get more detailed LDAP error output.
-
Why is the Administration Logs page empty?
I also checked:
https://some-proget-url/administration/logsbut that page is empty as well. Should LDAP test errors appear there, or are they only written to container stdout/stderr?
-
How can I troubleshoot the LDAP/AD connection further?
Since the current output only showsLdapReferralException, I’m not sure whether this is caused by:- LDAP referrals not being followed,
- an incorrect base DN,
- domain controller behavior,
- missing bind permissions,
- TLS/LDAPS issues,
- or something else.
Is there a recommended way to get the full LDAP exception message and stack trace from ProGet?
-
How should ProGet logs be forwarded to Grafana/Loki?
Since ProGet would be a central part of our infrastructure, we would like to monitor it properly, including:- application errors,
- authentication/authorization failures,
- LDAP/AD issues,
- package publishing/deletion events,
- audit-relevant events,
- alerting on failures.
What is the recommended approach for forwarding ProGet logs from the container to a central logging system such as Grafana Loki? Should this be done via container stdout, mounted log files, a logging driver, or another supported mechanism?
Thanks in advance for any help or pointers.
- Where should ProGet container logs be written?
-
RE: ProGet configuration as code (IaC)?posted in Support
I love the idea here
Here is another handy way which reuses the existing pgutil / Inedo.ProGet tooling:
Program.cs:#!/usr/bin/dotnet run #:sdk Microsoft.NET.Sdk #:package Inedo.ProGet@2.1.3 #:property JsonSerializerIsReflectionEnabledByDefault=true using Inedo.ProGet; Console.WriteLine($"Starting ProGet bootstrap"); var client = new ProGetClient("http://localhost:8090", "test123"); var groups = client.ListUserGroups(); foreach (var group in DesiredState.Groups) { if (await groups.AllAsync(g => g.Name.Equals(group.Name)) != null) { await client.UpdateUserGroupAsync(group); } else { await client.CreateUserGroupAsync(group); } } var users = client.ListUsersAsync(); foreach (var user in DesiredState.Users) { if (await users.FirstOrDefaultAsync(u => u.Name.Equals(user.Name)) != null) { await client.UpdateUserAsync(user); } else { await client.CreateUserAsync(user); } } var connectors = client.ListConnectorsAsync(); foreach (var connector in DesiredState.Connectors) { if (await connectors.FirstOrDefaultAsync(c => c.Name.Equals(connector.Name)) != null) { await client.UpdateConnectorAsync(connector.Name, connector); } else { await client.CreateConnectorAsync(connector); } } var feeds = client.ListFeedsAsync(); foreach (var feed in DesiredState.Feeds) { if (await feeds.FirstOrDefaultAsync(f => f.Name!.Equals(feed.Name))) { await client.UpdateFeedAsync(feed.Name!, feed); } else { await client.CreateFeedAsync(feed.Name!, feed.FeedType!); await client.UpdateFeedAsync(feed.Name!, feed); } } var settings = client.ListSettingsAsync(); foreach (var setting in DesiredState.Settings) { await client.SetSettingAsync(setting.Name, setting.Value); } Console.WriteLine("ProGet bootstrap completed successfully."); public static class DesiredState { public static IReadOnlyList<SecurityUser> Users { get; } = [ new SecurityUser { Name = "svc-ci", DisplayName = "CI Service Account", Email = "svc-ci@example.com", Password = "svc-ci", Groups = ["proget-admins"], }, ]; public static IReadOnlyList<SecurityGroup> Groups { get; } = [ new SecurityGroup { Name = "proget-admins", }, ]; public static IReadOnlyList<ProGetConnector> Connectors { get; } = [ new ProGetConnector { Name = "nuget-org", FeedType = "nuget", Url = "https://api.nuget.org/v3/index.json", Timeout = 30, MetadataCacheEnabled = true, }, ]; public static IReadOnlyList<ProGetFeed> Feeds { get; } = [ new ProGetFeed { Name = "nuget-internal", FeedType = "NuGet", Description = "Internal NuGet packages with nuget.org connector", Active = true, UseApiV3 = true, Connectors = ["nuget-org"], RetentionRulesEnabled = true, VulnerabilitiesEnabled = true, PackageStatisticsEnabled = true, }, ]; public static IReadOnlyList<SettingsInfo> Settings { get; } = [ new SettingsInfo { Name = "Web.BaseUrl", Value = "http://localhost:8090", Description = "Full root URL for this installation of ProGet. This should start with http:// or https://", ValueType = SettingsInfoValueType.Text, }, ]; }You can run it with
dotnet run Program.csor Visual Studio Code. It is easy to debug and extend. -

RE: Migrating from Sonatype Nexus to ProGetposted in Support
I checked the
/var/log/postgresql/postgresql-17-main.logfile but it is empty. -
RE: Migrating from Sonatype Nexus to ProGetposted in Support
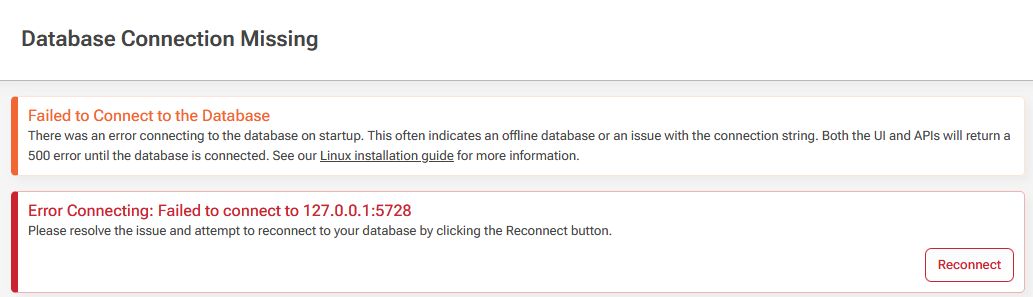
On my test instance i ran the "maven.org Full Maven Connector Index Job" manually but it seems to have crashed. Now ProGet does not start anymore because it can't reach the database. I already restarted the docker container but that didn't fix the issue.
How to get the logs from the built in database to check what's wrong?

I already checked https://docs.inedo.com/docs/installation/postgresql but the troubleshooting info did not help:
root@dc6f66f82da3:/usr/local/proget/service# ./proget query --file=- unexpected argument: query unexpected argument: --file=- Description: Hosts the ProGet service and performs various operations. Usage: proget [command] [options] Commands: run Runs the ProGet service. resetadminpassword Switches to the built-in user directory and changes the Admin account password to "Admin". upgradedb Upgrades the database schema version to this version of ProGet. database Commands for performing database maintenance operations -
RE: Migrating from Sonatype Nexus to ProGetposted in Support
Thank you for the detailed response! I see your points. I will check the links :)
-
Migrating from Sonatype Nexus to ProGetposted in Support
Hi there,
I’m currently evaluating ProGet as an alternative to Sonatype Nexus, and I have to say the product looks very promising so far—great work

I have a couple of questions:
- Authentication exclusions
In our previous Nexus setup, we had certain endpoints excluded from authentication due to compatibility issues with other tools. I attempted to recreate this behavior in ProGet.

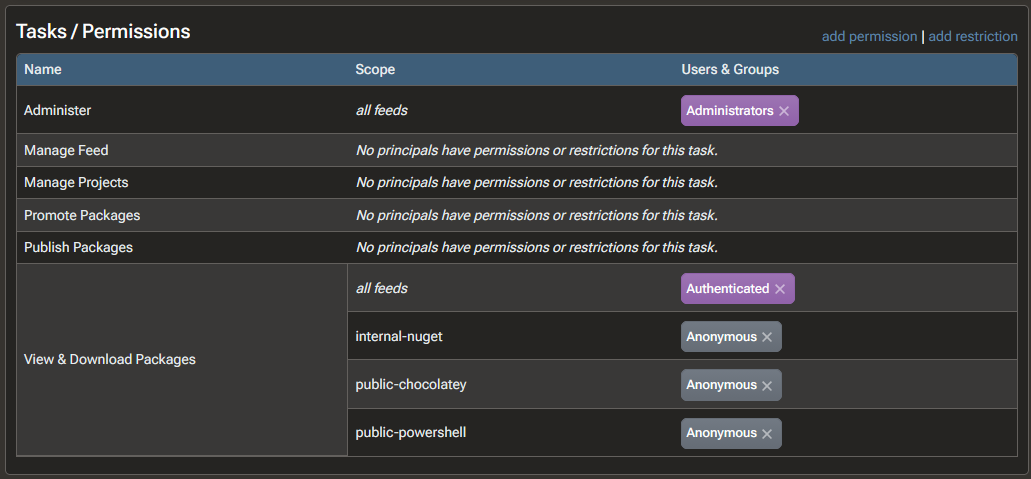
With the current configuration, accessing https://proget-test.some-company.net/nuget/internal-nuget/v3/index.json still requires authentication. Am I misunderstanding the configuration? Do these rules need to be inverted?
My goal is to have security enabled by default, with explicit exceptions for certain paths.
- Vulnerability analysis updates
On the vulnerability search page https://security.inedo.com/vulnerability/search?showOnlyInedoAnalysis=True the most recent entry appears to be from January 16, 2026. Is there a reason there haven’t been newer analyses published since then?
- Prometheus / OpenTelemetry integration
The documentation mentions that “by integrating Prometheus with Inedo products, users can gain real-time visibility into metrics, detect anomalies, and address issues” (see: https://docs.inedo.com/docs/installation/logging/installation-prometheus), which I completely agree with. However, from what I can tell, ProGet itself does not currently expose any Prometheus-compatible metrics. Is that correct? Are there any plans to add native Prometheus and/or OpenTelemetry support to ProGet? From an operations and observability perspective, I think this would be an excellent fit.
Thanks in advance for your help — I appreciate it.
- Roadmap
https://inedo.com/products/roadmap looks outdated
Best regards,
K