Welcome to the Inedo Forums! Check out the Forums Guide for help getting started.
If you are experiencing any issues with the forum software, please visit the Contact Form on our website and let us know!
Performance Issues after upgrading ProGet to v2024.16 from v6.0.20
-
We are experiencing severe performance issues and a lot of timeouts for ProGet. We recently upgraded to ProGet v2024.16 from v6.0.20. We are seeing the following error in the logs:
An error occurred processing a GET request to "https://<proget_endpoint>": Timeout expired. The timeout period elapsed prior to obtaining a connection from the pool. This may have occurred because all pooled connections were in use and max pool size was reached.

System.InvalidOperationException: Timeout expired. The timeout period elapsed prior to obtaining a connection from the pool. This may have occurred because all pooled connections were in use and max pool size was reached.
We have New Relic monitoring installed on our ProGet server and here is the data:
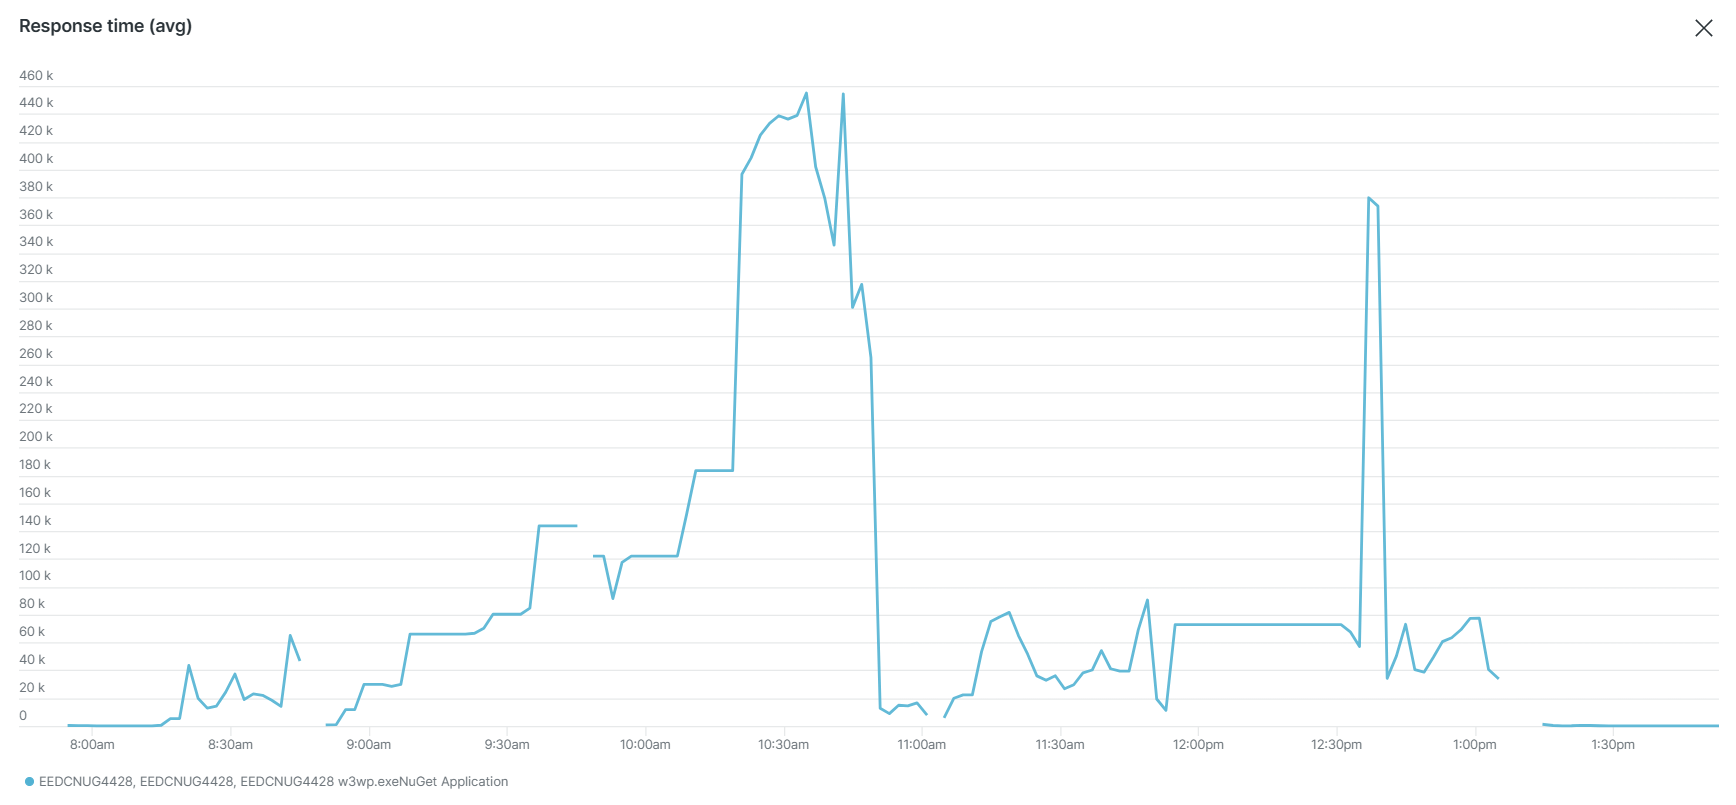
Response times are VERY high:
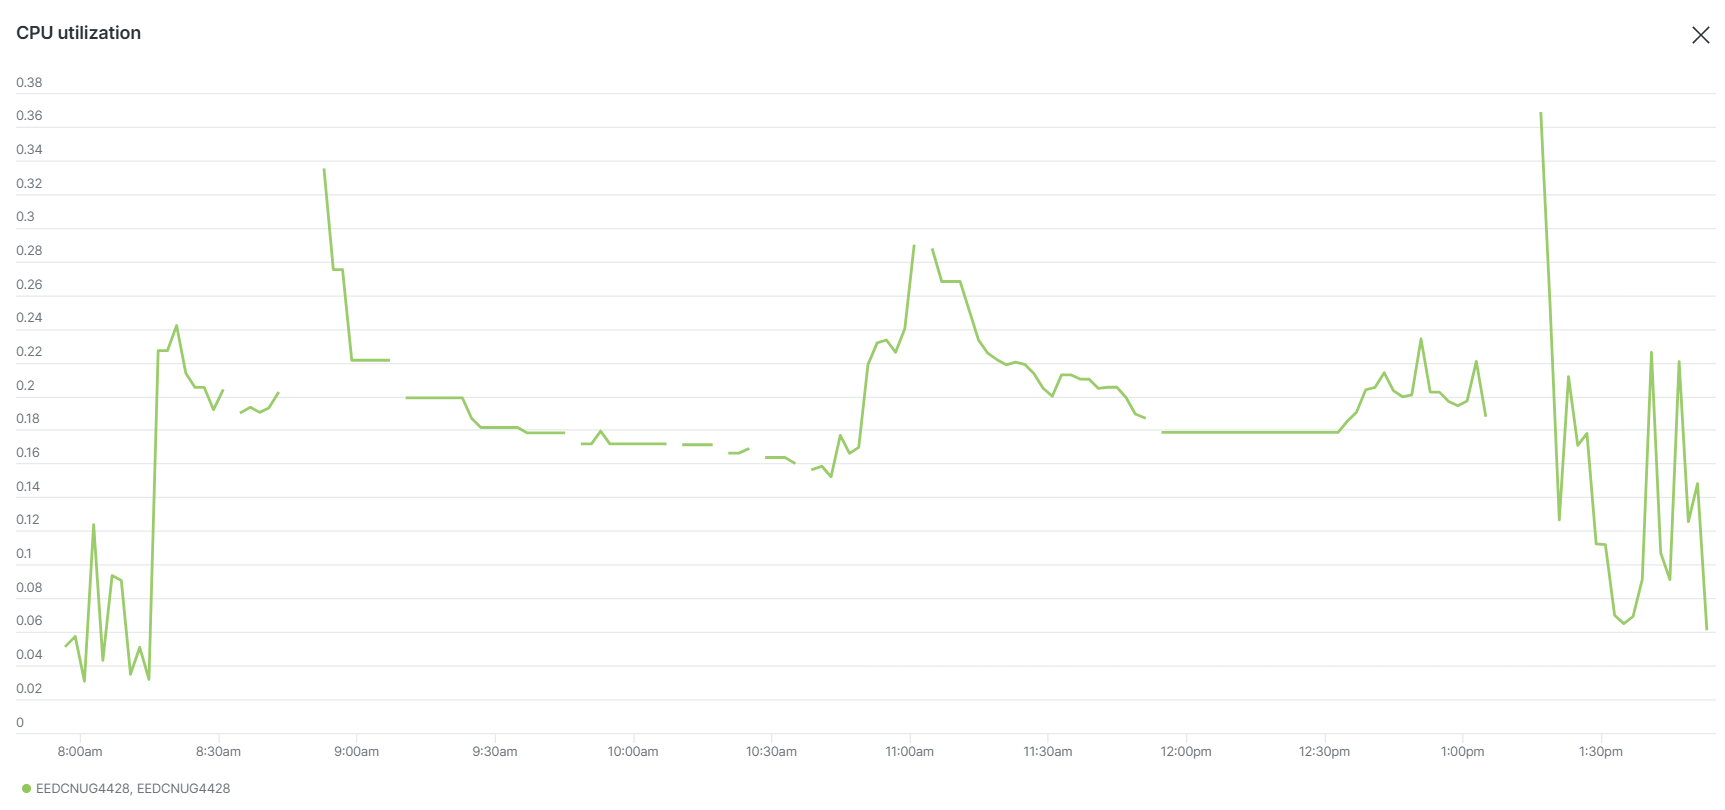
Spikes in CPU usage that coincide with the period of performance degradation:
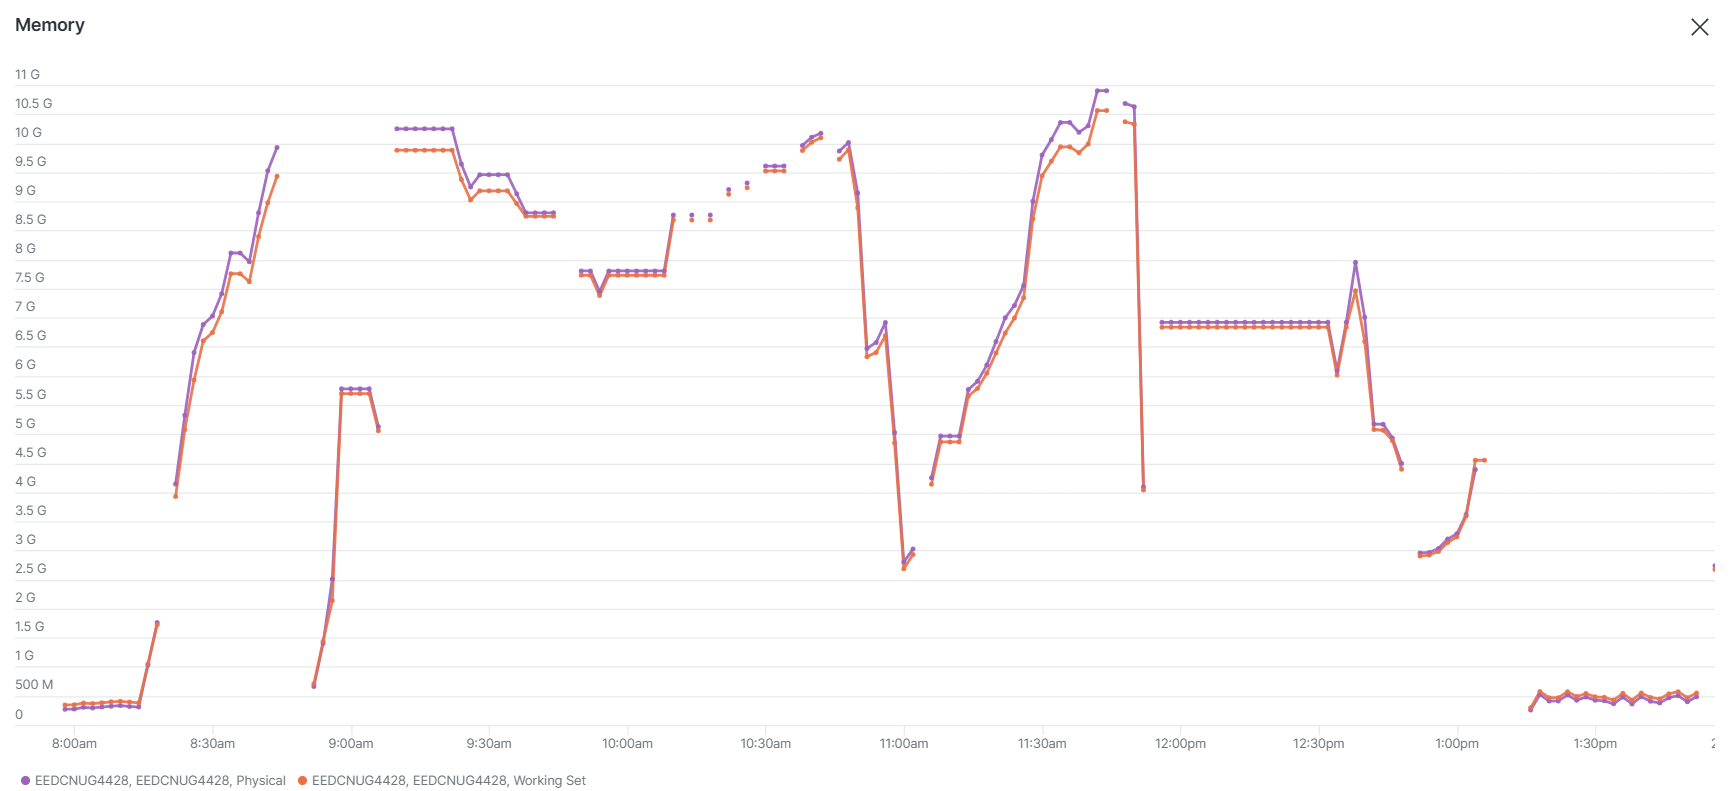
Spikes in memory usage that coincide with the period of performance degradation:
Huge spike in GC time during the period of performance degradation:
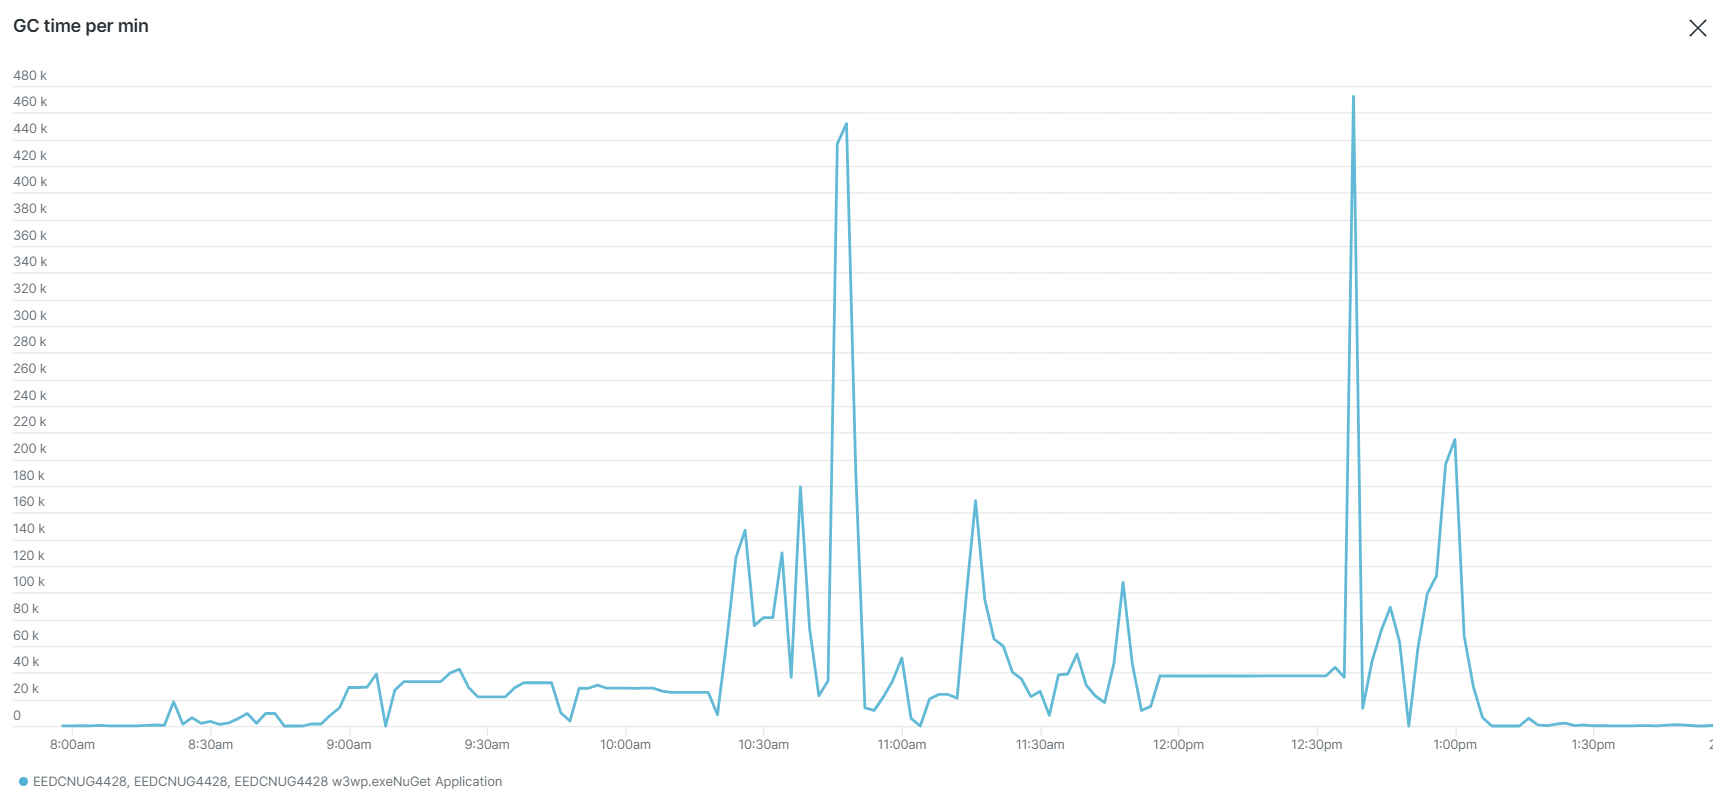
Notice in the charts for response time, CPU usage, and memory usage, there are moments when New Relic had no data. This probably suggests that ProGet was down during those moments. What could be causing this?
Could you please help us with this issue?
-
Some added context:
We do not have a multi-server solution at the moment. It is a single ProGet instance hosted by IIS.
Also v6.0.20 had similar issues with slowness of ProGet on the UI side (when trying to access ProGet via web url, we got 500 and the website was unusable via UI). However, on v6.0.20 we did not get as many timeouts from API calls which seems odd.
Our performance degradation is very sporadic and has happened multiple times today (Note: We upgraded to 2024.16 on Monday 8 pm ET). We tried increasing our resources (memory and CPU) and also tried setting the "Web.ConcurrentRequestLimit" to 500 but it still has the same issue.
We generally use V2 API for a lot of these API calls and I know you suggested on this forum that we should move to v3 but that is not something we can do tomorrow right away (so is switching to clustered solution).
Are there any other recommendations you can make to remedy the situation to have immediate impact?
Reverting back to the old version is not ideal at all since the back up would take us to the state of the ProGet server (1 day ago) resulting in data loss.
-
Hi @sneh-patel_0294 ,
The underlying issue is that you ProGet server is getting overloaded, and you need to find a way to reduce peak traffic or switch to a load-balanced solution. Removing NuGet V2 APIS, chained connectors, etc. are a good step in reducing traffic.
See How to Prevent Server Overload in ProGet to learn more.
Keep in mind that the clients (build servers, dev workstations) are sending 1000's of simultaneous requests to ProGet at one time. ProGet is not a static file server (unlike nuget.org), and each request must be authenticated and often proxied/forwarded to connectors. There is only one network card on the server, and this is what happens when it gets overloaded.
As for why it's causing errors now, this is a result of changes to the underlying platform (.NET Framework to .NET Core). The older platform did a better job of throttling traffic under extreme load and, for whatever reason, didn't timeout as much.
You can configure a throttle in ProGet by going to Admin > HTTP/S Settings > Web Server > "edit", and then set a value of 100 or so. You mentioned a value of "500", but I would just set it to 100.
Cheers,
Alana
-
This post is deleted!
-
Hi @atripp, we've modified it to 100, however, we are still seeing time out issues during high peak. Also, we notice that the connection pool errors have went down but we face the following error still:
Connector <connector_name> Error: The operator has timed out.What did you mean by chained connectors? We have self connectors that point to "localhost".
Are there any other immediate measures we can take to avoid these timeouts? Otherwise, our only option would be to revert back to the previous version till we move to a clustered solution.
Note: There is somewhat of a faster recovery after changing to 100 concurrent requests.
-
Hi @atripp , UPDATE: We have decided to move forward with the multi-server approach. Our plan is to create fresh new servers and install the same version of ProGet on them. However, we would like to keep our existing single ProGet instance on until we migrate to the clustered solution.
Do you have any feed back for us in order to avoid possible road blocks and errors?
Also, do you recommend using Windows fileshare (as shared storage) between the multiple ProGet servers? How does ProGet handle writes to the same resource? Will it cause any issues/delay when multiple servers are trying to write to the same thing?
Do you also recommend multiple DB instances or is a single DB instance that multiple servers can connect to sufficient?
-
Hi @sneh-patel_0294 ,
A "chained connector" would be something like, "(Feed A) --> (Feed B) --> (Feed C)". We've seen some set-ups like "(Feed A) -> ((Feed B) + (Feed C --> Feed F)+ (Feed D --> Feed G))", and every now and then a "loop" (where Feed A eventually connects back to Feed A). Those are really bad for performance, especially with NuGet v2 which requires a query every every single connector.
As for a clustered installation, here's our set-up guide for that:
https://docs.inedo.com/docs/installation/high-availability-load-balancing/high-availability-load-balancingBut to answer your questions... a sstandard share drive and a common SQL Server is fine. The main thing is to spread the incoming network traffic across multiple web nodes.
Cheers,
Alana
-
@sneh-patel_0294 and as an FYI, if you haven't already, you can request a ProGet Trial key from My.Inedo.com, and then set it to ProGet Enterprise, which supports the Clustered installation
-
Hi @atripp, we are currently working to migrate our ProGet to clustered solution. As part of the migration, we are first testing it out using a test DB and test files from our test ProGet instance (we cloned our test ProGet instance's drive).
Our team setup a shared storage space. We now run the ProGet service using a domain account that has access to the shared storage space. After modifying the path to "Storage.PackagesRootPath" to point to the shared storage space, we get the following error when trying to download a package:
Access to the path '\\<NAME_OF_SHARED_STORAGE_SPACE>\ProGet\ProGet\Packages\.nugetv2\<FEED_ID>\Amazon.CloudWatch.EMF\Amazon.CloudWatch.EMF.2.1.0.0.nupkg' is denied.We made sure that the domain account has permissions for this shared storage. I can even access this path (via network file share UNC path) from the ProGet server using the domain account.
What could be the issue? How do you refer to network share paths in the settings (I just inserted the path as shown in the error, as it is in the field for "Storage.PackagesRootPath")?
-
Hi @sneh-patel_0294 ,
That error message is coming from the operating system; it doesn't necessarily mean a permissions issue.
Does it happen every time for every package, consistently?
If that's the case, then it's certainly some kind of permission configuration. The user running the ProGet Web Service (or IIS App pool) may not have the appropriate permissions to the folder.... or it could be something related to network access? I don't really know.
The operating system is opaque with the error message, and you might have to use a tool like procmon to see exactly what's going on. That will show you what programs/processes request file handles.
If this is sporadic, then it means the file is locked. It's possible for ProGet to lock the file, but it's unlikely and would require basically two processes trying to write to the same file at the same time. We've only seen that with misconfigured build servers that publish same build twice.
More likely the file locking is coming from like backup, index scanning, or malware that's masquerading as "security software". Procmon will also advise this, if you can catch it.
-- Dean
-
Hi @dean-houston, thank you for the reply. This is happening for every package consistently. After migrating to a shared storage space for all the package files, we are not able to access any of the files from ProGet. Here is the context of that error in more detail (if that helps):
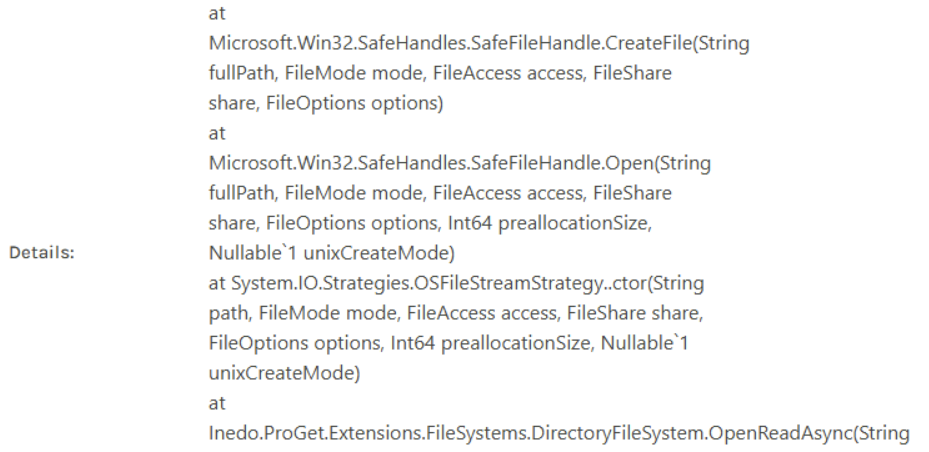
How do you normally define UNC path (for network share) within ProGet settings?
Also, is there a difference between the user running the ProGet Web Service and IIS App pool? By default, the ProGet runs via a Network service, we changed the user to a domain user to run the service. That domain user is able to access the files via network share path on the ProGet machine:

-
Nevermind, we solved it. We had to also change the identity of the AppPool in IIS to point to our domain user. After changing it, it was working.
-
Great news, thanks for the update!
-
@dean-houston @atripp , for some reason we are not able to load the ProGet Cluster Configuration page after clicking on "More Info":
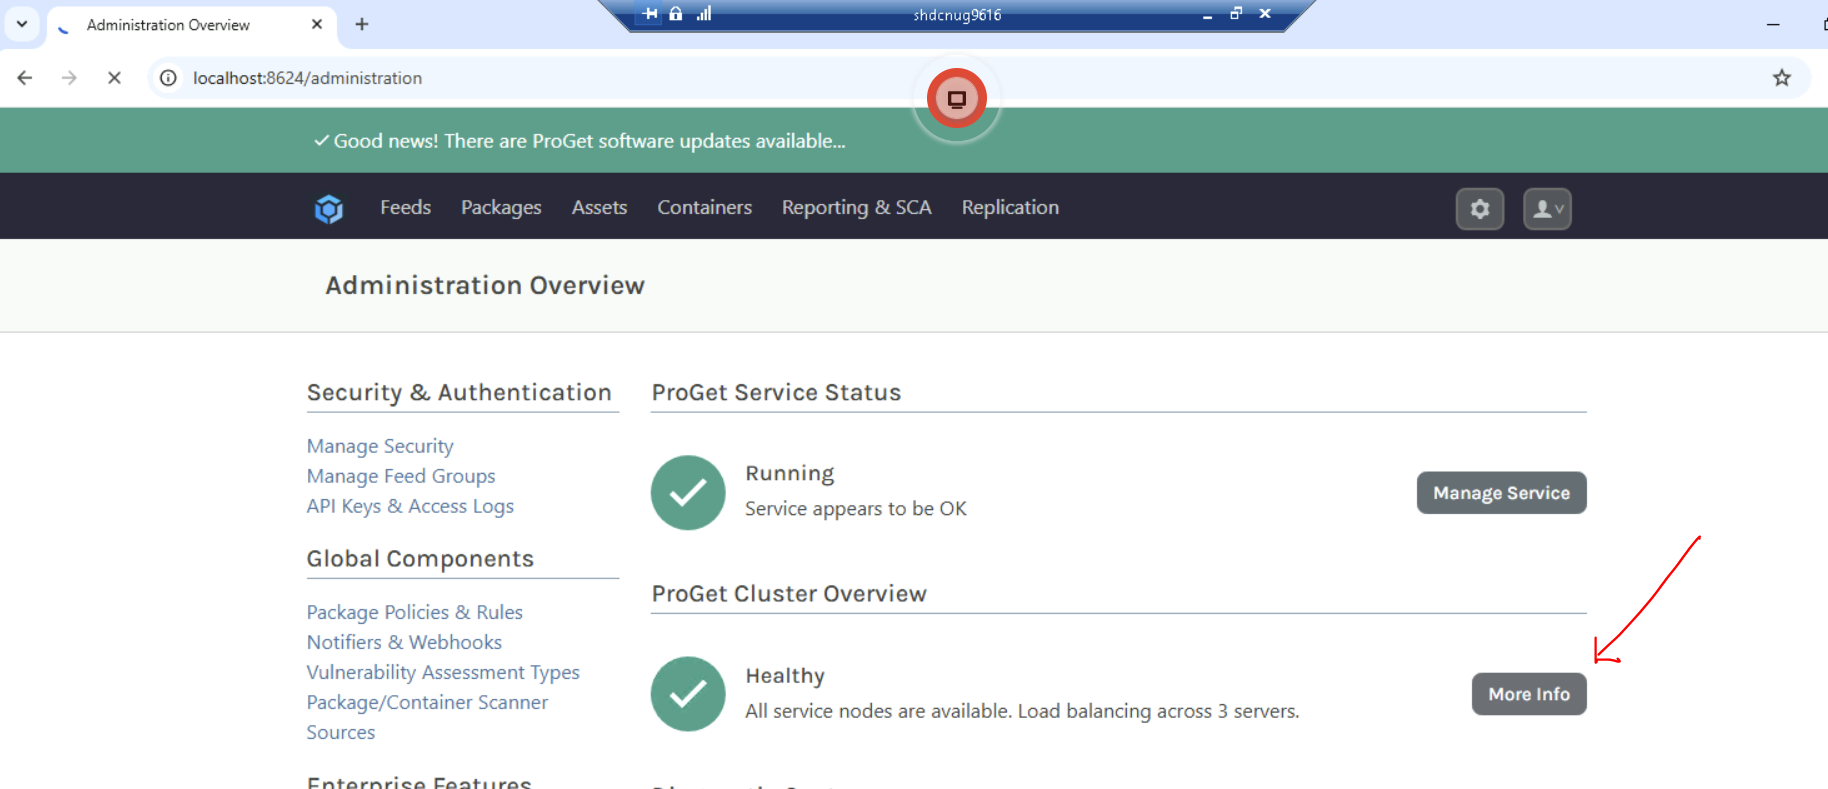
The page tries to load indefintely as seen in the image.
However, you can see it still displays the status of the cluster. Does that mean there is something wrong with the load balancer?
-
Hi @sneh-patel_0294 ,
That page mostly displays some items stuff from the database (specifically
ClusterNodes_GetNodes) and attempts to do some network communication on port 33237; there's likely some kind of firewall/trap that's preventing communication on that port, and it will timeout after awhile.You should be able to visit that page from any browser, as opposed to localhost. That page is mostly just useful in making sure the load-balancer is configured correctly.
-- Dean
-
Hi @dean-houston, as you can see in the screenshot below, I am unable to access that page even from non-localhost endpoint. It just loads indefintely (no error or anything). Is it the port 33237 issue? Or could there be something else? It was working before (like 2-3 days ago).
How would I go about disabling the cluster in this case (since we have just done this on a test environment for now)?
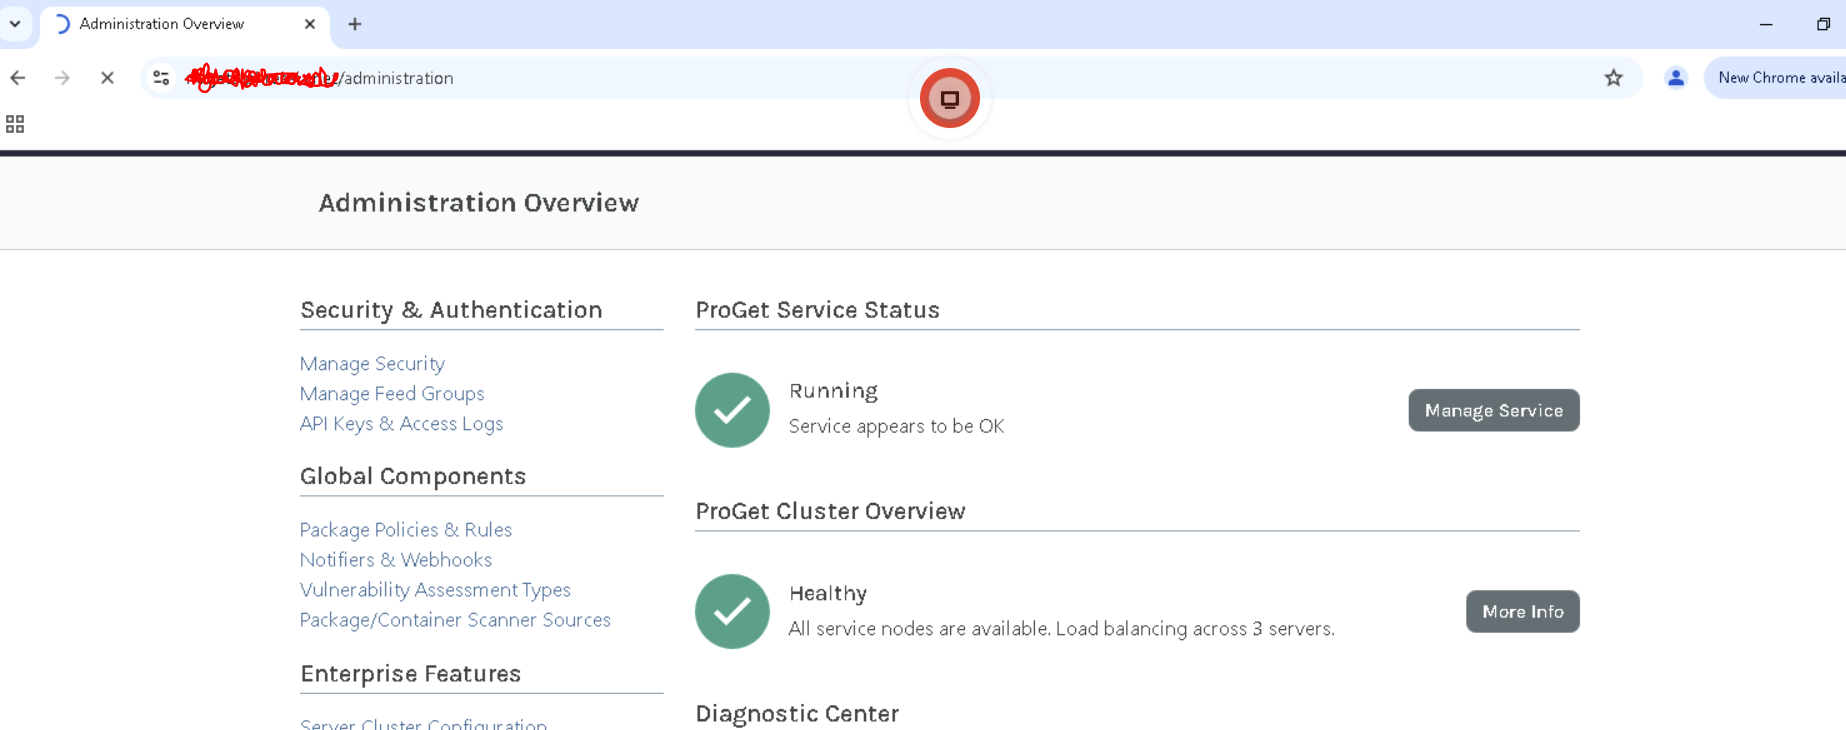
-
Hi @sneh-patel_0294 ,
We've never seen that before nor had anyone else report it. The only thing I could guess is network communication on port 33237. I guess I would try restarting the web server? I would try it on different servers?
It's just really weird behavior, but that's the onnly thing I could guess.
You can access a dialog to disable the Automatic Failover, which would also disable the network communication via
/administration/cluster/configureChanging the license key would also disable it. These are the only ways I can think to test if it's "something" blocking/delaying/interfering the 33237 communication. We've seen some firewalls do that.
-- Dean
-
@dean-houston Oh okay. Weird. Is there also a path to access the status of each server in the cluster (similar to the one showed /administration/cluster/configure) ?
-
@sneh-patel_0294 I don't think so, its only displayed on that page...