Welcome to the Inedo Forums! Check out the Forums Guide for help getting started.
If you are experiencing any issues with the forum software, please visit the Contact Form on our website and let us know!
ProGet log deletion query takes 26 hours
-
Hello all,
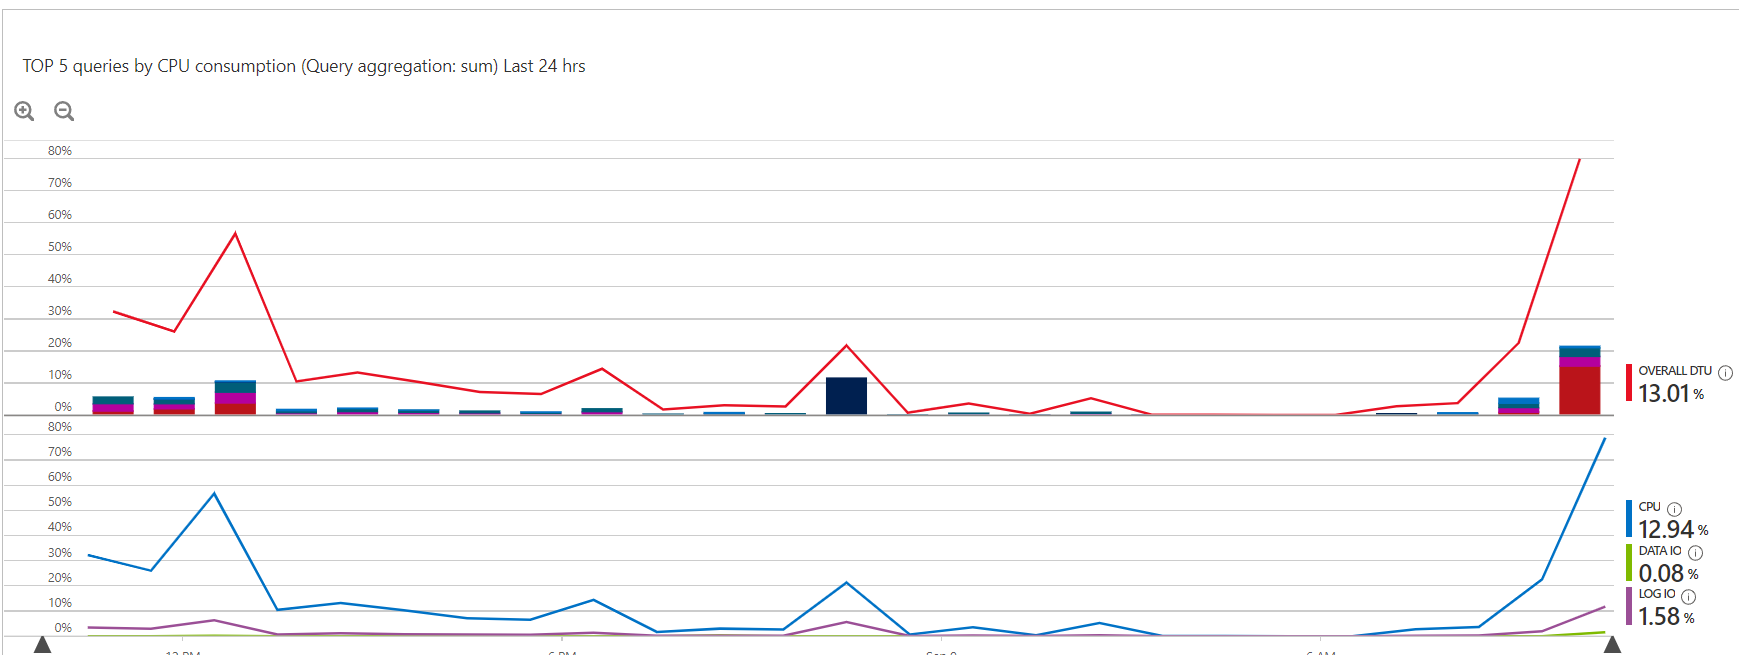
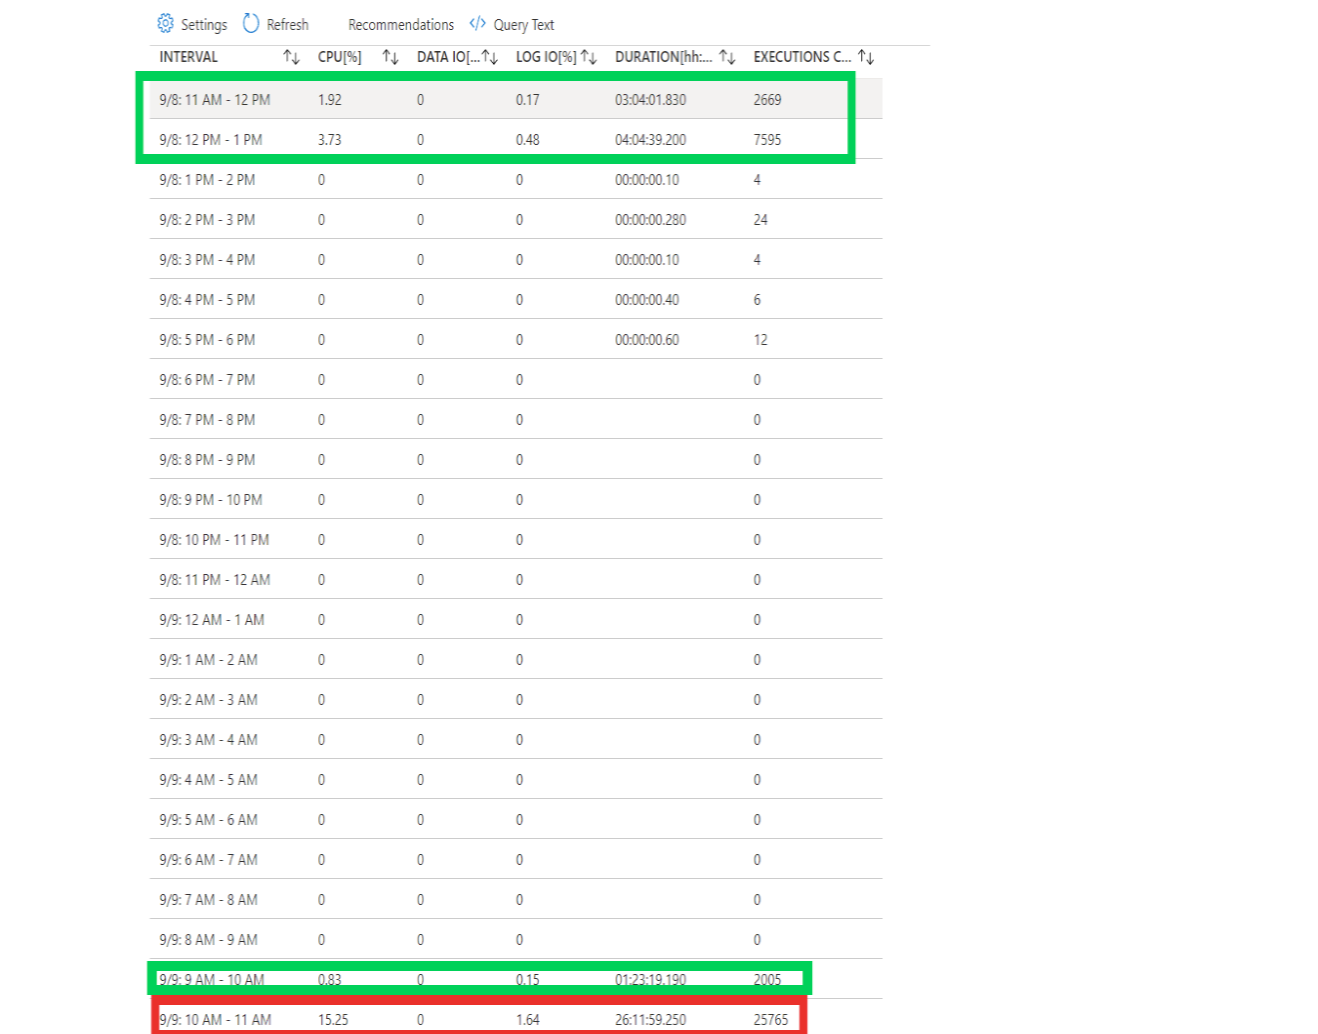
We had a small issue in production today that forced us to restart the container: the ancient log deletion query ran over 26 hours, with 15% cpu used on the DB instance.
The service eventually collapsed into unresponsiveness due to database DTU throttling when the second identical query started and the workers started using the service intensively (around 9:45 local time).
The culprit is this query:
WITH LM AS (
        SELECT RN = ROW_NUMBER() OVER (PARTITION BY [Message_Level]
                                           ORDER BY [LogMessage_Id] DESC)
          FROM [LogMessages]
    )
    DELETE
      FROM LM
     WHERE RN > 1000
The deployment is the container image v6.0.19 on Azure with an Azure SQL server instance.
Here are some screenshots of the app and db performance logs:
DTU during outage

DB query stats

DTU at the end of outage

App perfs during outage

Run logs for this query

-
Could this be related to this issue? https://inedo.myjetbrains.com/youtrack/issue/PG-2189
-
Hi @jerome-jolidon_1453 ,
Looks like you found the place where that was fixed; that query is a weak point when there's intensive database logging. About the only time that happens is when the server is overloaded with a traffic spike and starts running into database connection errors. So those just pile up.
It could also happen if some one left on Feed-level logging (Admin > Advanced setting, we do not recommend it).
Cheers,
Alana
-
I checked, we don't have feed-level logging enabled.
Very well then, I'll push to have our instance upgraded quickly so we don't run into it in the future.
Thanks for the confirmation.
Sincerely,
Jérôme Jolidon
-
@jerome-jolidon_1453 said in ProGet log deletion query takes 26 hours:
Could this be related to this issue?foodlehttps://inedo.myjetbrains.com/youtrack/issue/PG-2189
Ok, that is clear now. Thank you for your answer.