Welcome to the Inedo Forums! Check out the Forums Guide for help getting started.
If you are experiencing any issues with the forum software, please visit the Contact Form on our website and let us know!
Buildmaster - High CPU database since 6.2.22
-
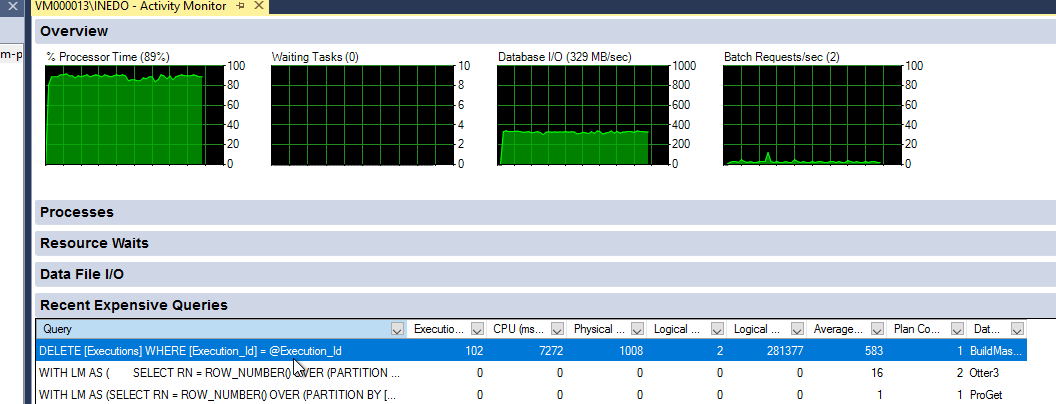
The request still eating all my CPU :(
-
How often is this happening? It shows 102 executions were purged, and based on the I/O there was a lot of logs deleted... this can be actually quite resource-intensive, as there are a lot of log data.
But this usually happen during off-hours, etc., so it shouldn't be disturbing.
-
@atripp
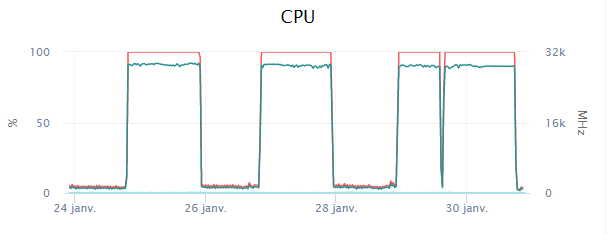
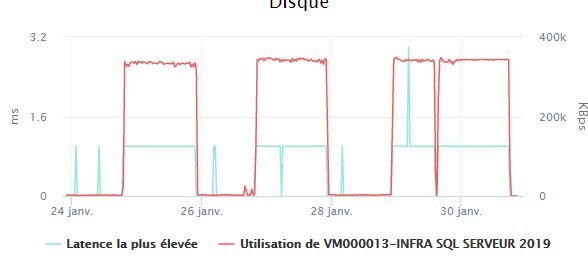
Unfortunately, it is disturbing.I join 2 screenshoot about the impact of the delete sql and it is happening during working hours.
I find that deleting several hours of CPU and IO for only 102 purged executions take too long
As I said, the problem exists since release 6.2.22.
I stopped all retention policies,
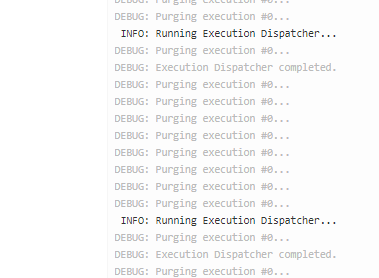
The problem occurs when the Manual Execution Cleanup is running
==============
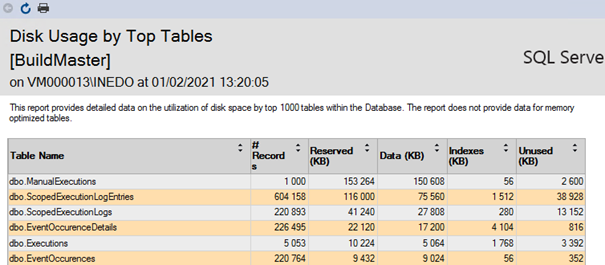
I ran again your code:
Before the execution:
After
(255268 rows affected)

Completion time: 2021-01-30T22:06:02.9603752+01:00
SELECT [ExecutionMode_Code], COUNT(*) FROM [Executions] GROUP BY [ExecutionMode_Code]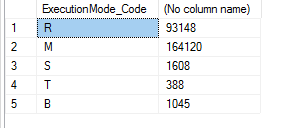
I set Retention.KeepLastManualExecutionCount to 50.
I will see what is going on
Best Regards
PhilippePS - Thanks for the help
-
This is what is happening if I force Manual Execution Cleanup to run.
The stop of the BuildMaster Service solved the problem, but BM is down :(
To be more complete, here is the steps I followed
1 Execution of the delete script
2 Restart buildmaster
4 Start Manual Execution Cleanup ==> Problem occurs
4 Start Manual Execution Cleanup ==> Problem occurs -
If I'm understanding correctly, did your the Manual Execution records go from 1000 to 164,000 in just a few days? If so, that would explain a lot....
These are the types of so-called Manual Executions:
- Importing or Exporting Applications
- Cloning and Applying Template to Applications
- Sync of Issue Sources
- Deploying Configuration file
- Upgrading Inedo Agents
- Sync infrastructure
They are supposed to only occur on a manual basis, like when you trigger something from the UI so you can get logs. Or, in the case of sync infrastructure, whenever infrastructure changes.
Any idea what all the manual executions could be?
-
@atripp said in Buildmaster - High CPU database since 6.2.22:
Importing or Exporting Applications **==> ** never done this **
Cloning and Applying Template to Applications **==> ** one time a month maximum ****
Sync of Issue Sources ==> Not sure what this is about ???
Deploying Configuration file **==> ** No ****
Upgrading Inedo Agents ==> done by Otter in my case
Sync infrastructure ==> Used to sync every 2 hours from Otter. I increased since the last post to one dayI have about 100-110 servers (Linux / windows) sync from Otter, whereas I am using a just a few for deploying application (about 25 actually).
I have plenty of RoleIt could be Sync infrastructure, any way to check ?
-
The
Execution_Configurationcolumn of theManualExecutionstable will give a clue; it's XML but if you expand the coluumn, you'll see the name of the manual execution.It's only supposed to log if something changed, however...
If there's a bug, one way to check would be to disable infrastructure sync, for the time being.
-
@atripp
I disabled the Infrastructure sync.
Then I clean up the tableTable size before
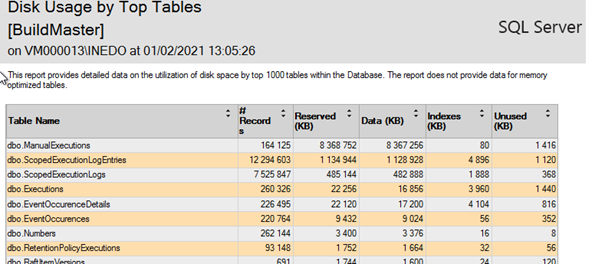
Disable Infrastructure sync
Stop buildmaster
Cleanup
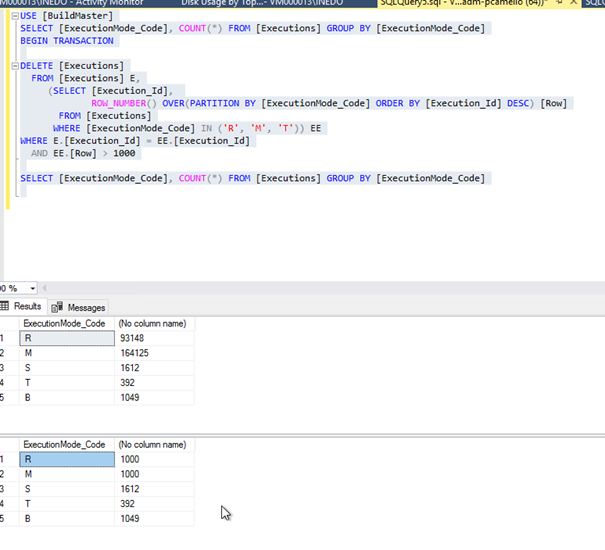
Table size after
Restart buildmaster
I will check tomorrow about the size and let you know
Thanks
-
I put some new screenshoots
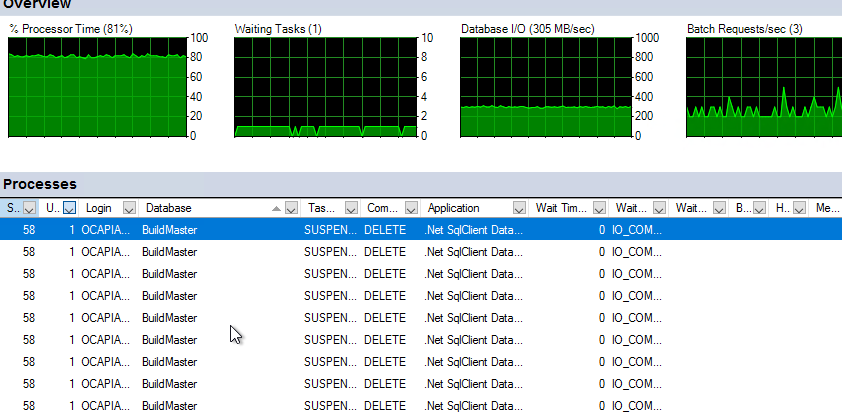
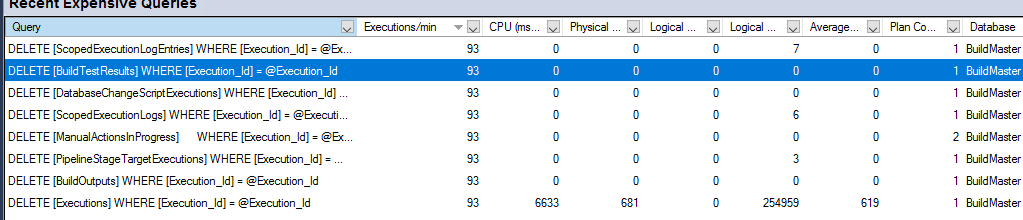
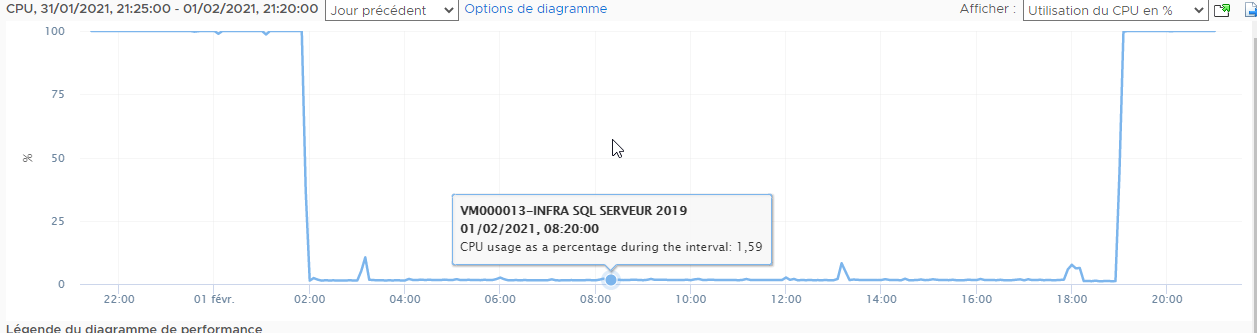
and a lot of this kind of msg
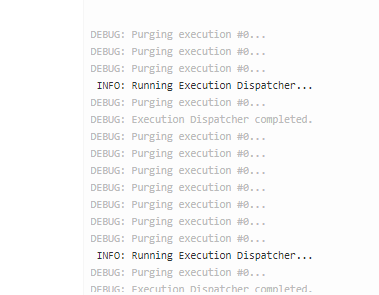
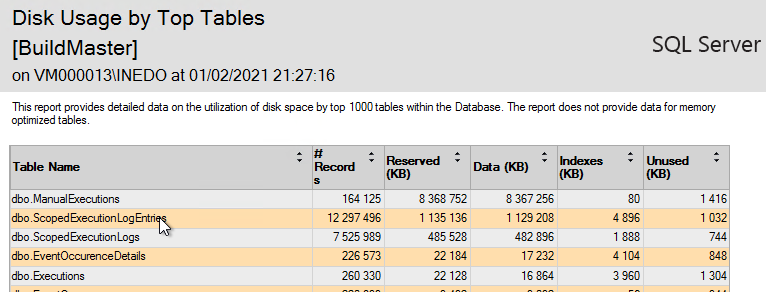
In 10 hours:
- ScopedExecutionLogentries x 20 (600k -> 12M)
- ScopedExecutionLogs : x 34
- ManualExecutions x 164
I set Service.AgentUpdaterThrottle to -1
I also increase to 1 hour in order to reduced log.

I will check tomorrow morning
-
Thanks @philippe-camelio_3885
So, the good news is, we've identified the problem. There was just a huge number of manual executions happening, for some reason, and the manual execution purging routine could never catch up. Changing those throttles wouldn't make a difference I'm afraid, as none will trigger a manual execution...
At first, can you please share the results of this query, so we can see what made all those?
SELECT [ExecutionType_Name], COUNT(*) FROM [ManualExecutions] GROUP BY [ExecutionType_Name]That will tell us what Manual Executions are around, mostly so we can understand what it is. I suspect, infrastructure sync.
That being said... the first thing I'm now seeing is that the report looks old. It's because the number of rows is 164,125, which is the exact same number as from before. So, I'm thinking, actually, you didn't commit the transaction in the query I posted before? It included a
ROLLBACKstatement as a safety measure... that's my fault, I should have said to only run DELETE if you were satisfied.Since the query seems okay (it reduced rows from 164K down to 1k), please run this:
DELETE [Executions]
  FROM [Executions] E,
     (SELECT [Execution_Id],
             ROW_NUMBER() OVER(PARTITION BY [ExecutionMode_Code] ORDER BY [Execution_Id] DESC) [Row]
       FROM [Executions]
      WHERE [ExecutionMode_Code] IN ('R', 'M', 'T')) EE
WHERE E.[Execution_Id] = EE.[Execution_Id]
  AND EE.[Row] > 1000
From here, it should actually be fine...
-
SELECT [ExecutionType_Name], COUNT(*) FROM [ManualExecutions] GROUP BY [ExecutionType_Name]
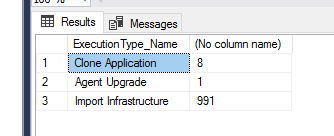
After my last post I purged again the table and it did not increase today. - no rollback I am pretty sure
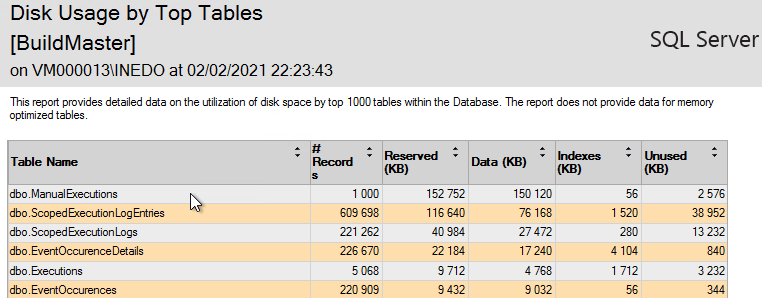
I put again Sync Infra to 1 hour and ran the to following SQL
use BuildMaster
SELECT [ExecutionType_Name], COUNT(*) FROM [ManualExecutions] GROUP BY [ExecutionType_Name]

SELECT [ExecutionMode_Code], COUNT(*) FROM [BuildMaster]..[Executions] GROUP BY [ExecutionMode_Code]
we will see tomorrow
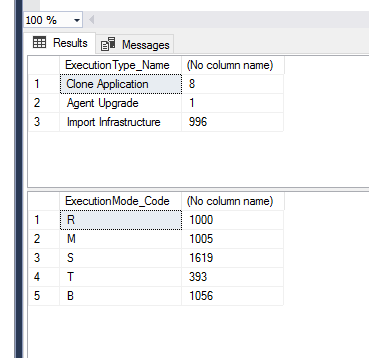
anyway thank you for your time :)
-
@philippe-camelio_3885 thanks. please keep us in the loop!
As expected, that's a LOT of infrastructure sync executions. I wonder why. Are there frequent variable changes on your servers/roles?
There's probably something off, where it's logging when it shouldn't. We can investigate that another time, but in the meantime, the upcoming optimizations in pruning the manual executions should make this go a lot faster next time.
-
I created on the average 2 servers a week and plenty of roles ...
I am using Otter for configuration management and script deployment so I need a lot of nested roles for the Linux and Windows servers.
I also add/change frequently role variables. -
Hello @atripp
Update ofthe day
Infra sync done every 3600 s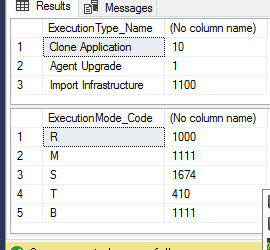
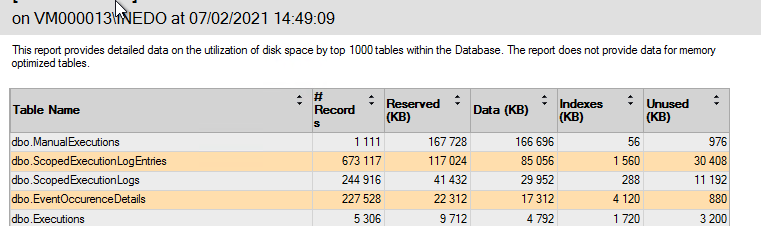
Few change in Otter this week - 12 new VM
I am not sure this the Infra sync the cause of the log ....
anyway, the Delete command worked fine specially after the commit
Cheers
-
Thanks for the update; and the upcoming fixes will certainly make it so that purging is much more efficient on the manual execution side, just in case there's an "Explosion" of executions like this.
So right now, my concern is that it's "logging every sync" (once per hour), due to a sort of bug or something. Can you check what's getting logged in Infrastructure Sync? You should be able to see this under Admin > Executions, and see if you can spot a pattern?
No rush. The infra sync executions should clearly show a change history of what was updated on the infra side.

Hello! It looks like you're interested in this conversation, but you don't have an account yet.
Getting fed up of having to scroll through the same posts each visit? When you register for an account, you'll always come back to exactly where you were before, and choose to be notified of new replies (either via email, or push notification). You'll also be able to save bookmarks and upvote posts to show your appreciation to other community members.
With your input, this post could be even better 💗
Register Login